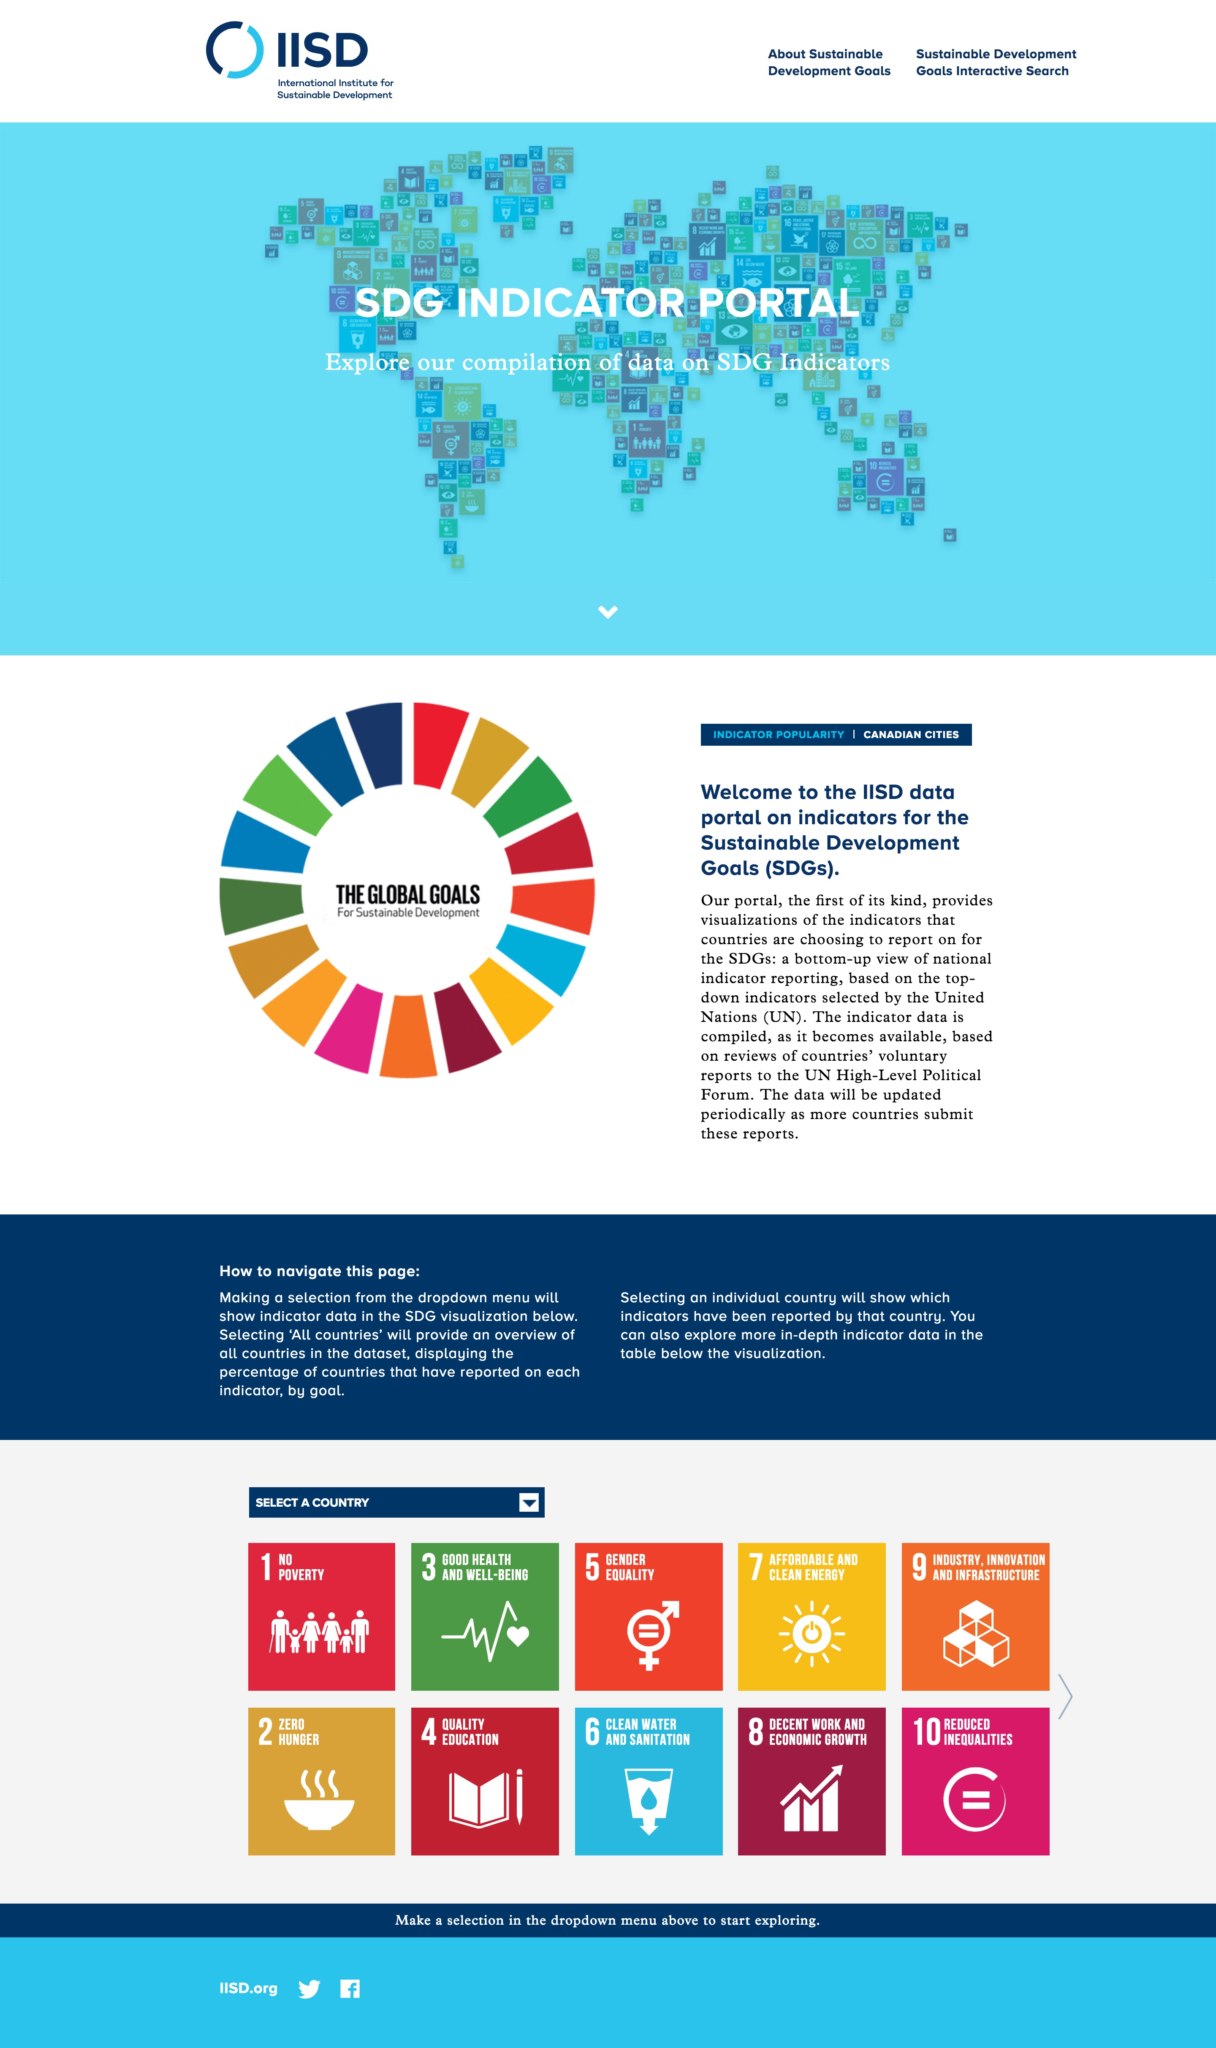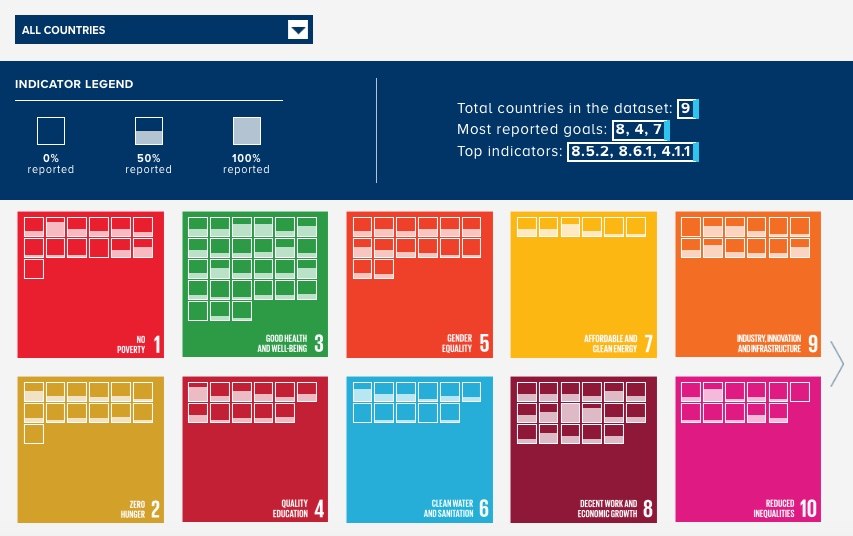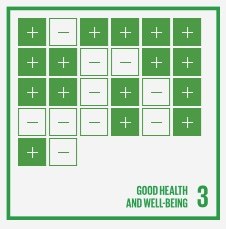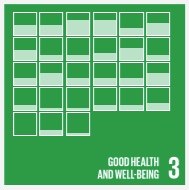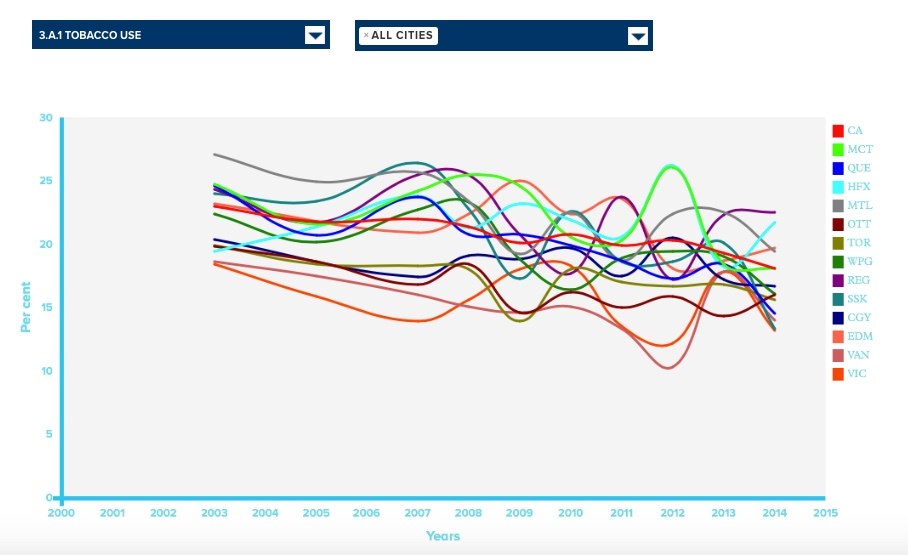
This project was an exciting and new challenge for our team: designing and developing a data visualization platform for the Sustainable Development Goals (SDGs). The International Institute for Sustainable Development (IISD) came up with a novel approach to the SDGs – to compile “data about data” that could show how different countries are committed to monitoring and achieving the seminal SDGs. BEE was asked to develop this idea into an online and user-friendly tool.
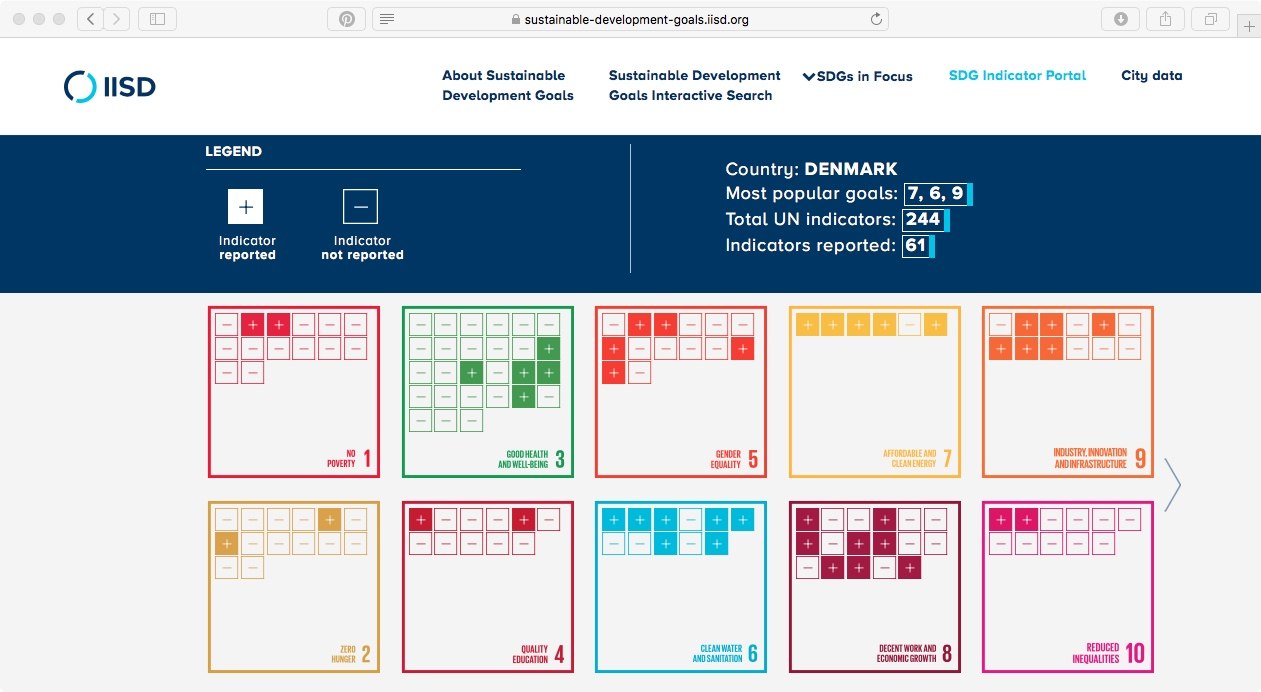
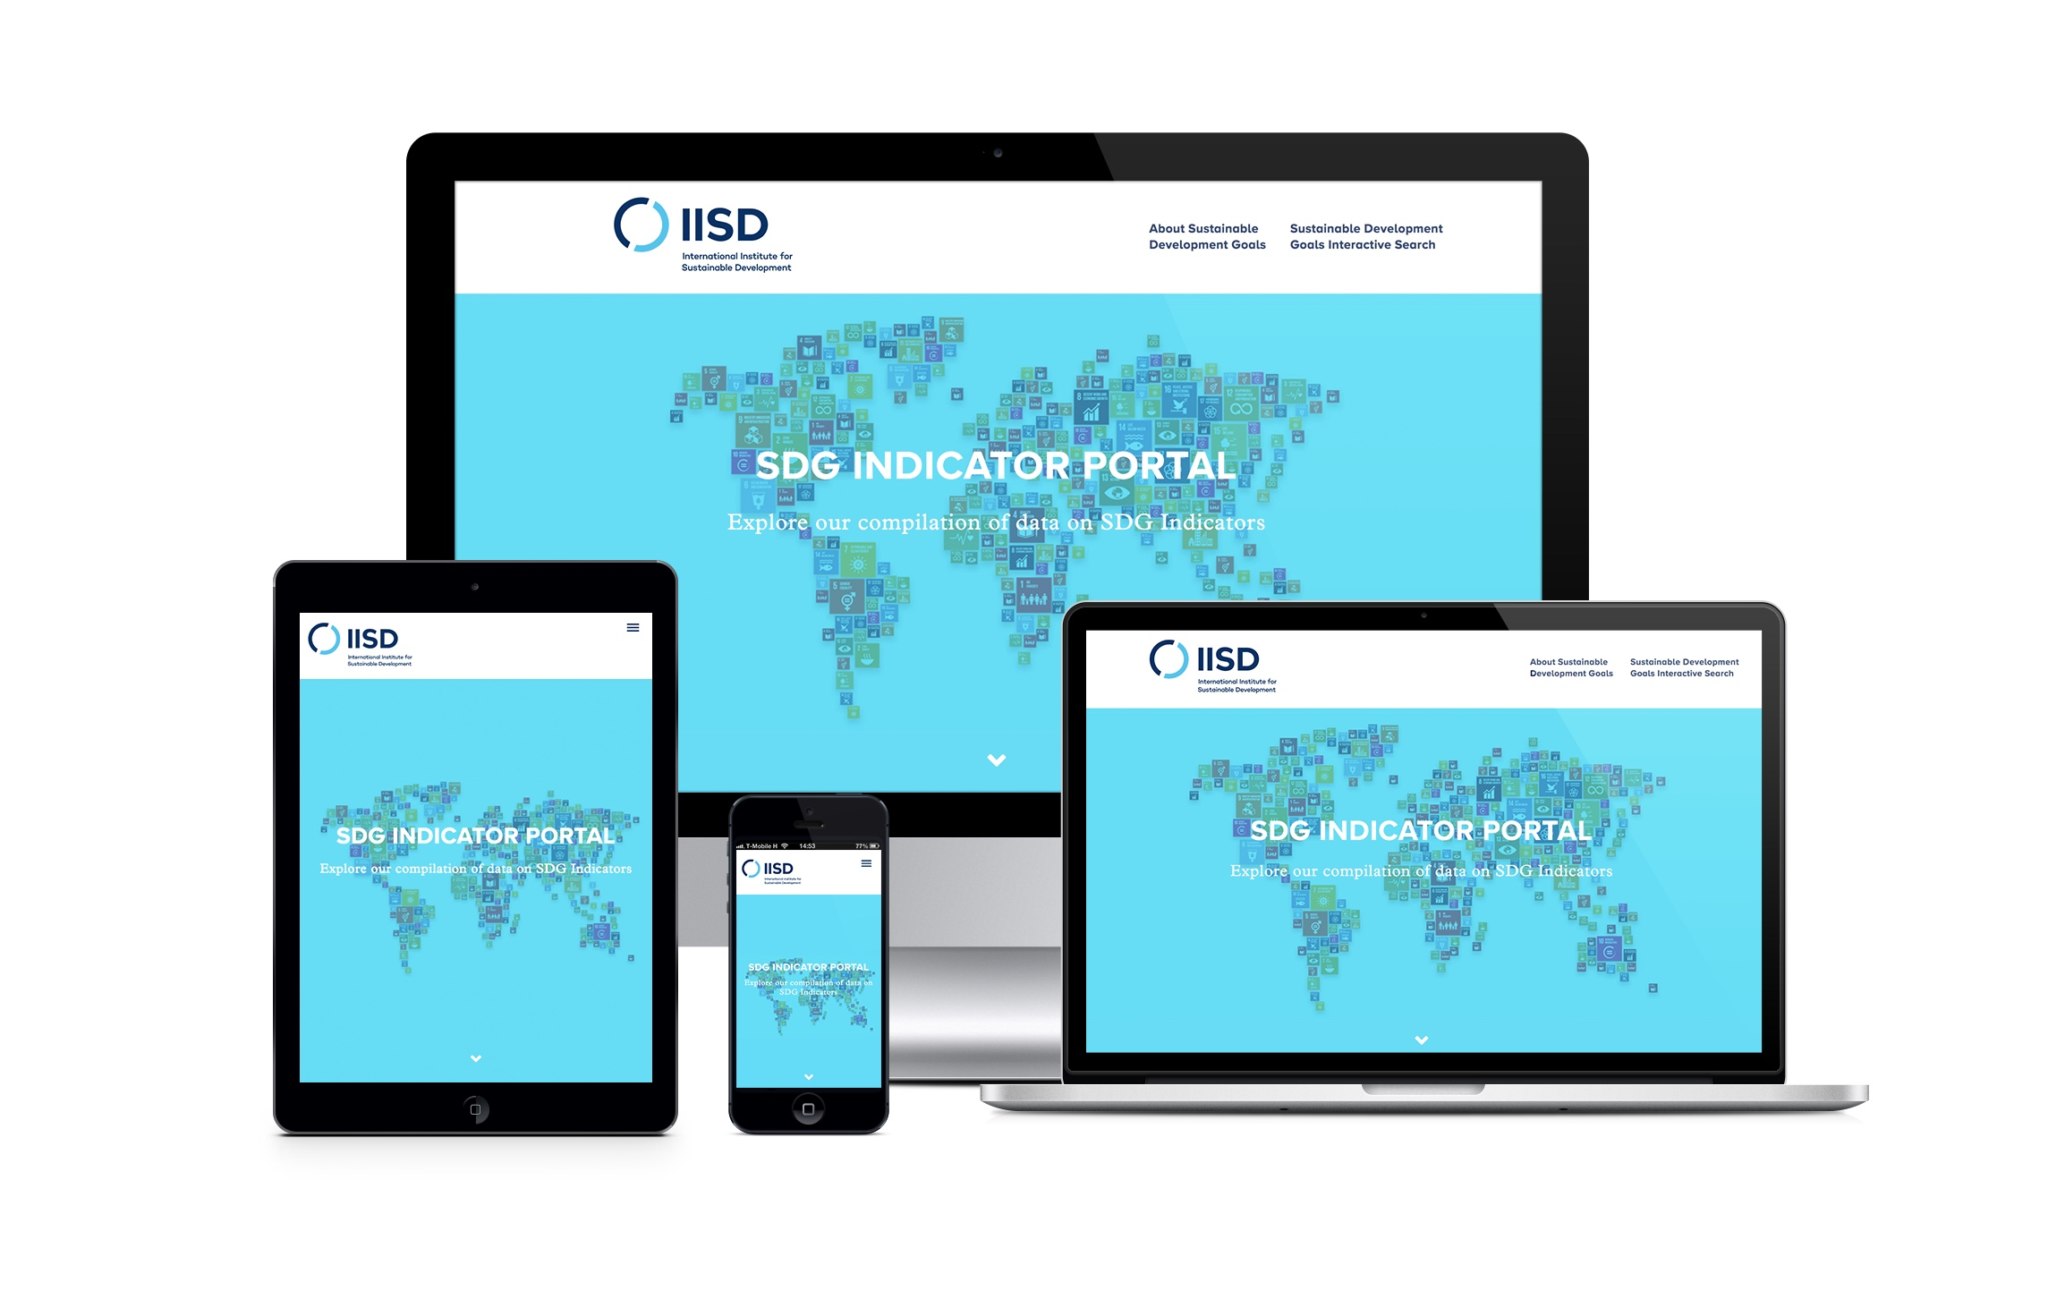
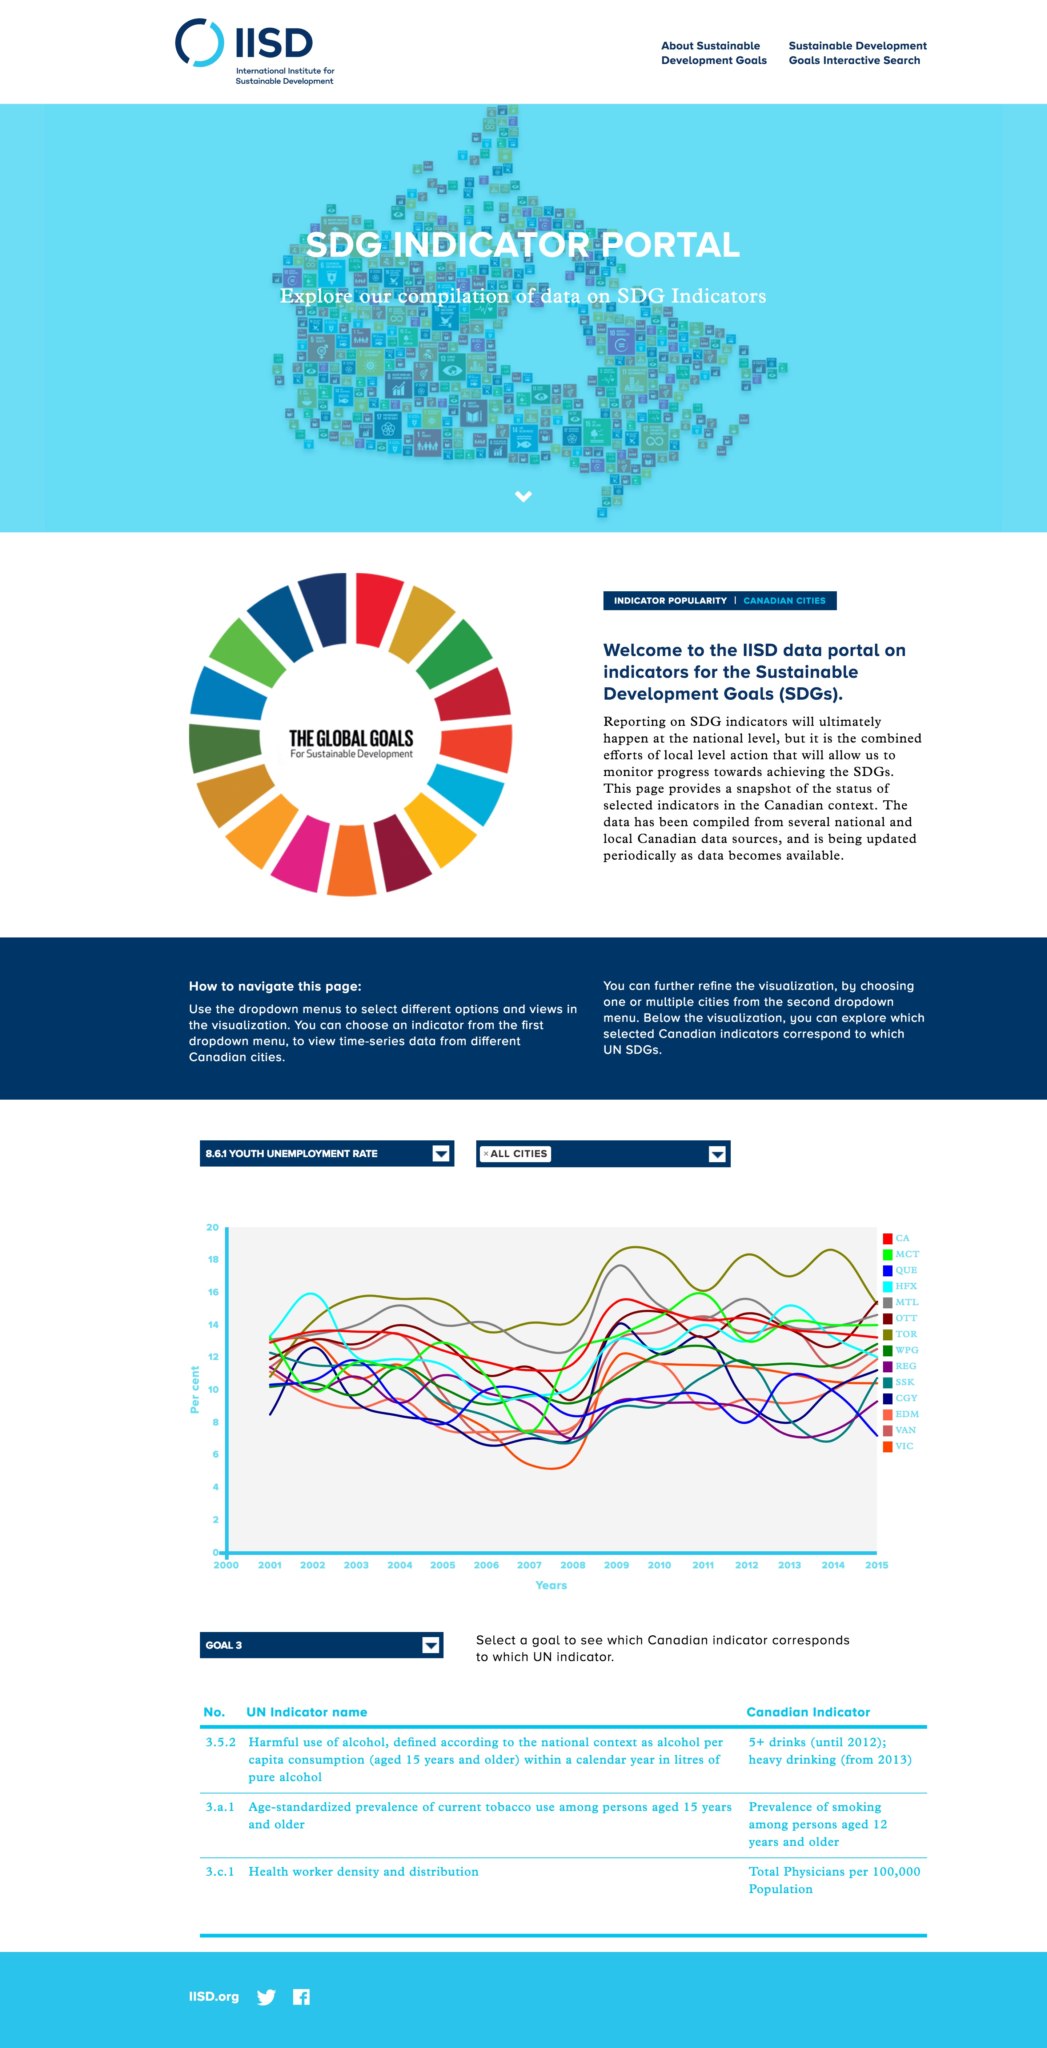
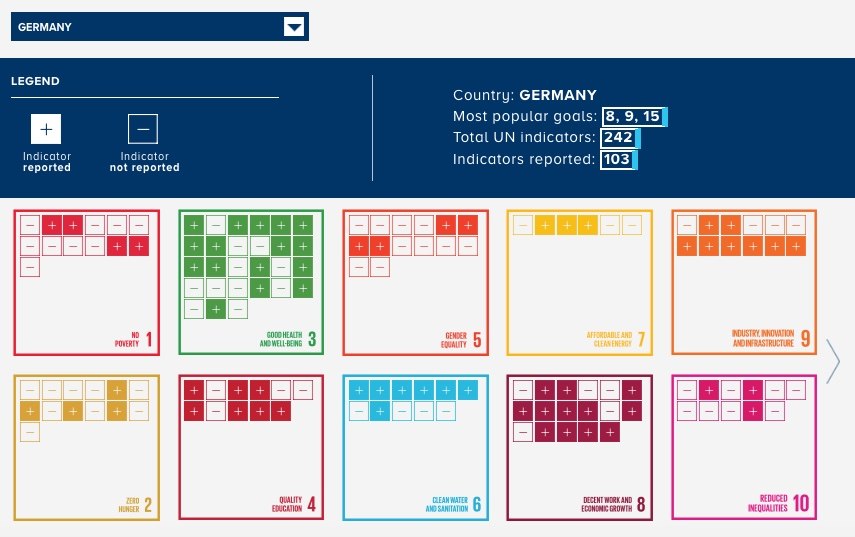
With over 240 indicators that cover a total of 17 globally-agreed goals, there is a massive amount of data to be collected on the SDGs. We faced the challenge of harmonizing and creating a visually appealing, yet still easy to use tool that could help users to navigate this data. The final logic and design of the platform reflects a system that is both easily updatable by the IISD (back-end) as they will be continuously refreshing the data, and also easily navigable by the online users (front-end). BEE was the primary driver behind the entire project, developing the structure, design and programming requirements for the platform.
As a new tool in the complex and growing SDG landscape, the SDG Indicator Portal has already been very well received by many working in this area. IISD coverage of the tool can be viewed here.